Wednesday, 4 September 2013


The Ins and Outs of Company Valuation


And A G Barr


Two readers of this blog have asked how the model used here for valuing a company's share price works. What follows might not be to the taste of all readers.
The chess grandmaster, Aron Nimzowitsch, titled his book on chess theory and practice My System. Most experienced investors probably regard their methodology in the same light.
So it is with the Joyful Investor. The inspiration for 'my system' is Buffettology (Simon & Schuster, 1997), authored by Mary Buffett and David Clark. Mary Buffett is Warren Buffett's former daughter-in-law and David Clark is an old friend of the Buffett family. Whether they describe Warren Buffett's method as they claim or not, their system is convincing. For a brief and incomplete outline of the method used to select stocks prior to the valuation model, see http://thejoyfulinvestor.blogspot.co.uk/2013_02_17_archive.html  and http://thejoyfulinvestor.blogspot.co.uk/2013_06_30_archive.html
Once a company has passed the initial hurdles, the valuation process commences. The aim of the model is to use three different approaches to find, in a fuzzy way, a company's intrinsic value. The three sub models  project earnings per share, 1 based on historical data; 2 based on equity per share and the return on projected retained earnings using historical data; and 3 based on projections for equity per share and return on equity using historical data. The formulae are included below at the end of this section.
As this is an earnings-based model, it is incomplete for businesses, such as banking, property and insurance, that require a balance sheet approach.
While it is impossible, in the space available, to explain in detail all the ins and outs of the methodology, in summary it works as follows:
1. Projecting earnings per share (eps) based on historical data V1 = (eps X (1+g1)n X PER)/ (1+d)n).

 i.            Preferably, the last three years and the first three years of a 10-year earnings record are averaged and provide an historical base for the company's compound growth rate(g1).

ii.            Eps are adjusted only for discontinued and/or new operations and truly extraordinary gains and losses.

iii.            Management guidance, depending on past reliability, recent trends in eps, broker forecasts and a review of external factors (competition, regulators,  overall  market) are taken into account.

iv.            The projection is limited to 5 years (n). Presently  2013-2017 or 2014-2018 depending on the company's year end.

v.            The 5-year projected eps is multiplied by the average valuation that the stock market has put on the company's earnings per share (Price Earnings Ratio -PER) in the past. The PER of competitor companies is taken into account.

vi.            The resulting future share price is discounted at a rate (d) that includes the cost of the company's debt, the company's operating risks and a margin of safety. The share's dividend yield is deducted from the discount rate. See http://thejoyfulinvestor.blogspot.co.uk/2013_06_30_archive.html for a further discussion of the discount rate.  
 

2.  Projected earnings per share based on equity per share and the return on projected retained earnings using historical data V2 = (eqps X (1 + (ROE%/100 X RET%/100)n) + eqps X PER)/(1+d)n)

 i.            The latest equity per share (eqps) is used as a base. As eqps is multiplied by the historic return on equity (ROE), it is immaterial whether assets are held at market value or cost or are tangible or intangible. Where equity is negative, one uses return on capital employed (debt + equity).

ii.            Here return on equity focuses on the return on new equity, for the most part retained earnings. The return on new equity per share is calculated by taking, preferably, the last 10 years eps and deducting the dividends per share paid in this period. The difference between the latest 3-year average eps and the first 3-year average eps provides the added return from the new use of capital derived from retained earnings and other sources.

iii.            Going forward, retained earnings per share (RET) are based on the historical record of retaining earnings and management policy, where this is stated.

iv.            Steps iv, v and vi above are repeated.
 

3.  Projected earnings per share based on projections for equity per share (eqps) and return on equity using historical data (V3 = (eqps X (1 + g2)n X ROE% X PER)/ (1 + d)n)

 i.            The same figure for eqps is used as in 2.i above.

ii.            The projected annual compound growth rate (g2) in equity per share is based on historical data, preferably, for the last 10 years.

iii.            The growth in eqps takes into consideration items that do not normally pass through the income statement. This includes charges/gains on defined benefit pension plans, share issues/buybacks, asset sales and certain tax items.

iv.            Recent historical data is used to arrive at the projected return on equity. This takes into account the variation, where significant, between the historical ROE and the ROE on new equity.

v.            Steps iv, v and vi of 1 above are repeated.
 

As with any model, there is the risk of 'garbage in, garbage out'. The following are some checks on the model.
a.       The model also produces valuations for 10 years forward. By comparing these values with the 5-year projection, odd results can be detected.

b.      It is easy to apply a sensitivity analysis to key assumptions - growth being the most significant.

c.       A significant change in the debt to equity ratio can distort results, and this may require adjustments to the data.

d.      Results that are quite out of line with the present share price need reviewing.

e.      Further valuations are based on the lowest PER reported in recent times and on the eps divided by the 10-year yield on corporate bonds of the same creditworthiness as the company. These provide both low and high range valuations.
The wise investor will use the valuation of a company produced by a financial model with a great deal of caution. It is a useful indicator, nothing more, and ignores:

1.       A change in management that can dramatically alter the expectations for a company.

2.       The chance of a takeover, a major disinvestment or acquisition.

3.        Sudden changes in the marketplace.

4.       Environmental, governance and political disasters.

5.       Big bumps in the stock market.

6.       The consequences of large-scale cluster buying or selling of the company's shares by its directors. 

And it is a salutary reminder that for every buyer of a stock who believes it is undervalued, there is a seller who believes it is overvalued at that same price.

The formula for the model is:
V = ( V1+V2+V3)/3
Where:
V1 = ((eps X (1+g1)n) X PER/ (1+d)n
V2 = (eqps X (1 + (ROE%/100 X RET%/100)n) + eqps) X PER)/(1+d)n
V3 = (eqps X (1 + g2)n X ROE% X PER)/ (1 + d)n
V = Value per share
eps = current earnings per share
g1 = annual compound growth in earnings per share%/100
g2 = annual compound growth rate in equity per share%/100
n = number of years
PER = average Price Earnings Ratio
d = discount rate%/100
eqps = current equity per share
ROE% = Return on Equity percent
RET% = Retained Earnings as a percent of earnings per share

-----------------------------------------------------------------------------------------------

A G Barr PLC


Image courtesy Wikipedia
 
A G Barr, the Scottish based soft drinks company, has a consistently good record of revenue and profit growth in the UK. Originally in the carbonated drinks market, with its lead brand Irn-Bru (formerly Iron Brew), the company now generates 22% of its revenue from still drinks and water. It acquired the water brand Strathmore in 2006 and the still drinks brand Rubicon in 2008. In 2012, it began marketing Rockstar, an American competitor to Red Bull, in the UK as franchisee. It has also launched a range of ice creams under the Rubicon label. The company is completing a new canning plant in Milton Keynes, which will double its canning capacity. 

In its 2013 Annual Report the CEO explained,

Our consumer base is growing in number, location and diversity. We aim to build long term relationships with all our consumers through our brands by appealing to both traditional and new tastes as well as by bringing exciting innovation to the market. We believe people want choice and we aim to build brands and develop innovation which meets this need. 

In 2012, A G Barr announced an agreed merger with its larger British competitor, Britvic. After a long delay caused by the Competition Commission, Britvic renounced the agreement. Given the very high indebtedness and spotty trading record of Britvic, A G Barr's shareholders seem to be the main beneficiaries of the failed merger. 

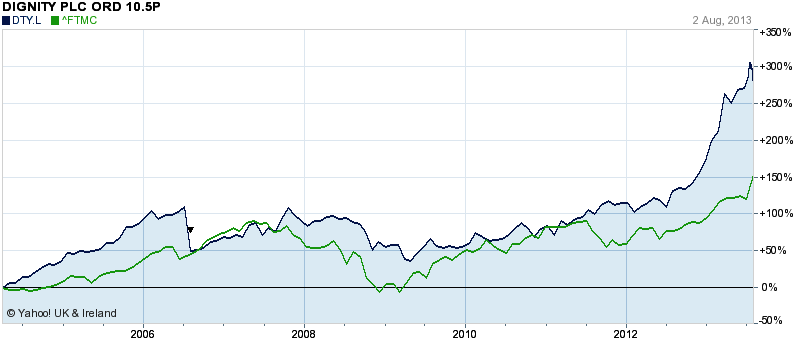
A G Barr shares (in red) have been an outstanding investment compared to the FTSE 250 (in orange) these past 5 years:


Image courtesy Investors Chronicle, click to enlarge 

Over the last decade, A G Barr has grown at a fast clip: 

1. Earnings per share have increased every year except 2013, cumulatively averaging 13% per annum.

2. Equity per share has increased by 12% per annum and dividends by 10% per annum cumulatively.

3. Return on Equity is an historical 21% which is equalled by the return on retained earnings, at 22%.

4. Net margins, a healthy 11% in 2008, are now an even healthier 14.7%.
 

And the company is financially in good health. Consider: 

1. Net debt is 19% of equity, and this is historically high only because of the 2008 purchase of Rubicon, the funding of the new canning plant and a 9-million pound special dividend paid in 2012. Net debt could be paid off with one year's post tax profits.

2. Operating cash flow for the period 2009-2013, once capital expenditure is deducted, covered the dividend payment 1.5 times. Once the dividend was paid, A G Barr was still left with 23 million pounds these last 5 years for acquisitions and the special dividend.

3. The defined benefit pension fund, now closed to new entrants, is in deficit to 3 million pounds. This is just 0.5% of the company's market value of 632 million pounds.  

The Barr family still controls 15% of the company's shares. One Barr, formerly Chairman, is on the Board and another is Company Secretary. Between April and June, there have been 2 director sales of shares at 546p and 503p worth 2 million pounds. And 2 director purchases at 543p and 536p worth 0.5 million pounds. Judged by their purchases, the weight of director opinion is not favourable, but might have been related to the end of the merger between Barr and Britvic. 

With its fine trading record, A G Barr commands a prospective price earnings ratio of 21 and a prospective yield of 2% at its present price of 544p. My model values A G Barr at 526p. This is based on a continuation of historical growth rates for earnings and equity, as well as maintaining the current return on equity and dividend payout. It uses the average PER of 20 and a dividend payout of 52% of EPS. All for the years 2014-18. 

The discount rate of 11.8% used for the model includes 3.8% for investment grade corporate bonds (from SLXX), 3% for operating risk and 5% as a margin of safety. 

The prudent investor will note: 

1. The failed attempt at the merger with Britvic by the first management team not to be led by a Barr could be followed by another grand scheme that will not prove, necessarily, to be beneficial for shareholders.

2. While the stalling in earnings growth in 2013 can be attributed to the cost, both in pounds and management time, of the failed Britvic merger, it nevertheless breaks a long-term growth record held by the company.

3. The franchise arrangement with Rockstar is a departure from the company's practice of only promoting its own brands. Franchise arrangements can end in tears.

4. Competition from Coca Cola has knocked Irn-Bru off its perch as the favourite carbonated drink in Scotland.

5.  Accounts receivable have been lengthening. They have increased from 57 days in 2009 to 63 days in 2012 to 72 days in 2013. The company explains that the 2013 increase was due to prepayments to be recovered and the earlier year-end closing date.

----------------------------------------------------------------------------


Wednesday, 14 August 2013


The Dividend Yield Trap


And Tesco PLC


Mousetrap, courtesy Wikipedia 

Income is a key requirement of an investment portfolio for pension funds, life insurance companies and many private investors. Bonds and short-term deposits once provided a secure source of income that more than compensated for the going rate of inflation. No more. Bank Rate has been stuck at 0.5% since March 2009, banks offer almost nothing for demand deposits and the yield on 10-year Gilts has been below the rate of inflation since January 2011. And no let up is in sight. 

As a result, investors have been concentrating their attention more than ever on company dividends. In response, companies have been increasing their payout. At 23 billion pounds, the dividends paid by FTSE 100 companies in Q2 2013 set a new record. 

Looking at the last 28 years, the return on the FTSE 350 Higher Yield Index (in green) has outperformed the FTSE 350 Lower Yield Index (in blue) in capital terms. Include the additional dividend that has been collected by the investor in the higher yielding portfolio and the long-term investor, who has stuck to higher yielding stocks, has outperformed the lower yielding portfolio by a country mile:  


Courtesy Yahoo, click to enlarge. 

But, according to the two indices, the position reversed itself in the post-Financial Crisis years 2008-2013: 


Courtesy Yahoo, click to enlarge.
 

What happened? In 2008 and 2009, many high yielding stocks - mainly in the banking, housebuilding, property and financial services sectors - stopped paying dividends entirely. Their share prices collapsed and then they were moved into the lower yielding index, from where their share prices recovered. Many stocks, which had a good history of dividend payments, collapsed in this short period. They stopped paying dividends and their price collapsed. Investors, who were focussed mainly on yield, were caught in a dividend yield trap.  

Nevertheless, an investment strategy based on dividend income makes sense for the long-term investor - see the article at http://thejoyfulinvestor.blogspot.co.uk/2013_01_20_archive.html  

However, investors should be wary of the dividend yield trap. A number of stocks with a seemingly good record for dividend payouts are at risk of disappointing investors. They include some of the UK's biggest companies that have fallen on hard times: 

1. Vodafone: yield 5.2%; dividend cover 0.97% on the average of the last 3 years earnings. The cash shortfall on its 2012 dividend was 1.7 billion pounds. (See http://thejoyfulinvestor.blogspot.co.uk/2013_05_26_archive.html) Competitive pressures and a stagnant economy in its main markets mean that Vodafone's own business is barely profitable. Vodafone relies on its 45% stake in Verizon Wireless and dividends that are determined by Verizon to keep going. The current share price of 197p is buoyed by hope that Verizon will buy Vodafone's share in Wireless for $100 billion or more and that those funds will go straight to Vodafone's shareholders.

2. BP: yield 5.2%; dividend cover 1.9 times on the average of the last 3 years earnings. The gargantuan capital expenditure requirements of BPs' business mean that, in the last 3 years, operating cash flow failed to cover capital expenditure by 3.1 billion pounds. The dividend was paid from debt and asset sales. BP is a shadow of its former self. To pay for the liabilities arising from the Deepwater Horizon disaster, BP has sold assets leaving its oil and gas production 42% below 2009 and its oil and gas reserves 44% below 2009. And its liabilities and contingent liabilities continue to rise. (See http://thejoyfulinvestor.blogspot.co.uk/2013_05_05_archive.html) BP's current share price of 445p is buoyed by the hope that BP will emerge from the ruinous costs of the Deepwater Horizon disaster and return to trading approaching pre-2010 levels. 

3. GlaxoSmithKline (GSK): yield 4.6%; dividend cover 1.03 times the average of the last 3 years earnings. Free cash flow covered the 2012 dividend 1.6 times. But GSK has been accumulating debt. In 2003, GSK held net cash of 1.6 billion pounds, in 2012; this had turned to a net debt of 14 billion pounds. Meanwhile, 2012 earnings were back at the 2003 level. Generic drugs have destroyed GSK's business based on research and development. (See http://thejoyfulinvestor.blogspot.co.uk/2013_05_26_archive.html) The current share price of 1683p is buoyed by the hope that new drugs in Phase II and Phase III trials with the US Food and Drug administration will bring GSK back to growth.  

Utilities are another mainstay for income investors. However, the high valuation on water and energy utilities is difficult to justify on their trading results and, perhaps more importantly, on their trading outlook post their regulatory reviews in 2014. For both Ofgem and Ofwat, in response to the present mood of austerity, have said that they will be expecting more from energy and water companies. All these companies are heavily indebted. 

1. Centrica: yield 4.1%, dividend cover 1.4 times is on a P/E ratio of 18. A solid business has been marred by capital misallocation on nuclear energy and wind farms. (See http://thejoyfulinvestor.blogspot.co.uk/2013_07_14_archive.html)  

2. SSE: yield 5.3%, dividend cover 1.1, is on a P/E ratio of 16. Though sound management has consistently brought an increase in dividends, the thin dividend cover means this must come to an end. (See http://thejoyfulinvestor.blogspot.co.uk/2013_01_20_archive.html) 

3. The water companies Dee Valley, Pennon, Severn Trent and United Utilities yield between 4.4 and 4.8% and all are on a declining dividend cover (1.2 to 1.3 time). P/E ratios between 16 and 18 do not discount the inevitable disappointment of the inevitable rights issues and more difficult pricing regimes that are on their way. (See http://thejoyfulinvestor.blogspot.co.uk/2013_07_07_archive.html). 

Long-term investors seeking a growing income stream would do well to look at other sectors and companies. Unilever, Reckitt Benckiser, Pearson, Royal Dutch Shell, Sage, Interserve, N Brown, Cranswick, Personal Group Holdings, James Halstead and British Sky Broadcasting all seem to offer better income prospects. But only buy at the right price. (Earlier articles on this blog cover these 11 companies). These stocks can be supplemented by income-orientated funds covering companies in foreign markets that are difficult for the individual investor to research, value and trade. Earlier articles on this blog cover BNY Mellon Newton Asian Income OEIC and the J P Morgan Global Emerging Market Income Investment Trust.


The wise long-term investor will have a 'buy and hold' strategy, but he or she will avoid the dividend yield trap by reviewing the portfolio regularly:  

1.  Companies are subject to sudden shocks that drastically reduce or improve their value. Think Deepwater Horizon, the banking crisis or, on the plus side, a takeover bid. 

2.  The trading outlook is rarely stable.

·         Macroeconomic changes (economic growth/recession, currencies, and interest rates) affect some companies more than others.

·         Regulators or governments, by imposing new conditions on companies, can significantly damage or benefit a company's trading outlook.

·         The business climate, via competition, new technology or a change in the market place, is constantly in flux.

·         Stock market fads can cause companies to be mispriced. This can bring stocks into the buying range for a patient investor or, conversely, push up the value of other stocks in a portfolio to the point where they are a screaming sell.

3.  Management can take decisions that have a long-lasting impact on a company's earnings. Big acquisitions, mergers, big disposals and demergers are sometimes the product of restless management. Sometimes they are the product of inspired management.
---------------------------------------------------------------------------------------------------------------

Tesco PLC


WPA poster, 1937, courtesy Wikipedia


Tesco has been through the wars. A withdrawal from its US venture at a cost of 1.8 billion pounds, the cessation of its Japanese venture and the recent merger of its stores with a Chinese retailer, leaving it with a 20% share of a business run from Beijing (the company is state-owned), have removed Tesco from any controlling interest in the world's three largest markets. 

Tesco, with 71% of its operating profits coming from the UK, remains heavily dependent on the UK consumer. In its UK home market, Tesco has suffered from a loss in market share, shrinking margins and a 0.8 billion-pound property write-down for land it no longer plans to develop. The year ending February 2013 saw the company barely in the black with large impairments and reduced trading results in the UK, Europe and Asia and in its banking subsidiary.  

Tesco's share price (in blue) has underperformed its largest rival, J Sainsbury (in green), by 30% since January 2012, when its difficulties became apparent: 


Graph courtesy Yahoo, click to enlarge 

Yet Tesco has undeniable strengths. Consider: 

1. Tesco, with 30% of the UK grocery market, is almost twice as large as its next largest competitors (ASDA and Sainsbury).  

2. Net debt, at 6.6 billion pounds, is 3 billion pounds less than in 2009. This reflects good capital management. Net debt is 40% of equity. Standard & Poor gives Tesco a long-term credit rating of BBB+. This is the lowest but one investment grade. 

3. UK revenue increased by 5% p.a. between 2009 and 2013. Per square foot, revenue was stable in a period when consumer demand has been flat. 

4. Underlying earnings per share (and for once this is more than a cosmetic number) were 36p in 2013, about the same as in 2012. 

5. The dividend was covered 2.4 times by underlying earnings in 2013. 

6. New management has a clear plan for putting the company back into financial health:

·         The net margin in the UK has been 'reset' to 5.2% to allow for better customer service. It has already employed an additional 8,000 staff in the UK.

·         Investment criteria are strengthened for its investment in online selling and international sales.

·         Capital expenditure is to fall from 4.2% of revenues to 3.5 to 4% of revenues.

·         Financial objectives are 'mid-single digit increases in profits', a return on capital employed of between 12 and 15%, and dividend payout to be around one-half of earnings per share. 

It is a sign of the change from the previous management's attitude that the Chairman, in the 2013 Annual Report, should write, "One of the greatest challenges for a business is to face itself honestly." And the Chairman promises "rigorous capital discipline." 

At the current price of 369p, Tesco shares are rated on a P/E ratio (on underlying earnings) of 11 and yield 4.0% (Sainsbury shares are rated on a P/E of 12 and yield 4.3%). My valuation model values Tesco shares at about 430p.*

The prudent investor will consider: 

1. Tesco is a massive company with over half a million employees. It could take years to turn around. 

2. The international operations that remain could still cause more impairment charges. 

3. Though Tesco claims to make money on its online business, it is very likely that margins here are lower than on store sales. No one else seems to make money from selling food online. 

4. The smaller grocers (Waitrose, Aldi and Lidl) are still taking business away from the larger retailers in the UK. 

5. The company's defined benefit pension scheme required a further provision of 735 million pounds in 2013. This is one-fifth of Tesco's regular annual pre-tax profit. And further provisions are likely. 

*Assumptions: Earnings per share growth 5% p.a. Equity per share growth 6% p.a. Return on equity of 16%. Average P/E valuation by the market 13. Dividend payout 50% of earnings. All discounted 2014 - 18 at 12.5% p.a. (5.5% is Tesco's weighted cost of debt, plus 2% for operational risk and 5% as a margin of safety). 

NOTE: The next article will be posted on 4 September.

Wednesday, 7 August 2013


Investing in Cyclical Businesses


And Braemar Shipping PLC


Economic cycle, courtesy Wikipedia

All businesses are influenced by the economic/business/stock-market cycle. Consider Dignity PLC, the UK quoted funeral service company. In its 2004 Annual Report, Dignity predicted its market for 2005:
"Historically, fluctuations in recorded deaths have tended to be self-correcting and the Board’s view on death rates continues to rely on government forecasts. Based on these forecasts, we expect 579,700 deaths in 2005."
The actual number of deaths in the UK in 2005 was 582,639. No other business I know can forecast demand a year in advance with 99.5% accuracy. And, from one year to the next, the number of deaths never varies by more than about 5%. Yet Dignity's share price (in blue) has fluctuated with the movements in the FTSE 250 (in green).
Graph courtesy of Yahoo, click to enlarge
Opposed to industries like Dignity's, what are normally considered cyclical industries - property, house building, engineering, mining, banking, shipping etcetera - present a difficulty for the long-term investor. Their irregular earnings, coupled with the threat of bankruptcies, ruinous 'schemes of arrangement' or desperately priced rights issues at the cycle's bottom, make them hard to value. The FTSE All-Engineer Index (in blue) compared to the Gas and Water Utility index (in green) illustrates the opportunity of investing in cyclical businesses:

Courtesy Yahoo, click to enlarge

And the FTSE Banks Index (in blue) compared to the same Gas and Water Utility Index (in green) illustrates the risks:

Courtesy Yahoo, click to enlarge

Long-term investors will prefer the steadier income streams from non-cyclical industries - utilities, food, personal care, healthcare etcetera (see companies valued in previous posts). And from those companies that have established a private market among consumers and/or professionals; these include the online and catalogue clothing retailer N Brown, the accounting software provider Sage, the education materials provider and financial publisher Pearson and British Sky Broadcasting, all valued in previous articles on this blog.
But there are times, and now is one, when many non-cyclical industries are valued too highly by the stock market. For instance, the funeral services company Dignity, at 1500p a share, is priced on a multiple of 22 times earnings and yields a scanty 1.1%. The long-term investor can sit on his or her cash or venture into cyclical companies. 
The cautious investor will want to:
1. Assess whether the cyclical industry is growing or not from one cycle to the next.
2. Understand what the causes of the cycle are. It helps to quantify the most relevant factors. Cyclical companies often refer to industry standard statistics when presenting their results.
3. Know at what point of the cycle the industry is in now. Timing is very important. Industry sources (trade journals, company news and reports) help.
4. Be prepared to sell when there is evidence the cycle has entered the boom phase. Here a target price and a stop loss are most useful.
---------------------------------------------------------------------------------------------------

Braemar Shipping Services PLC


Unloading at port of Mumbai, India, courtesy Wikipedia

Shipping volumes depend on international trade, and international trade grows - and falls - at about twice the rate of world GDP. Since 2000, merchandise exports have grown at a cumulative 5% per annum. This includes the 19% fall that occurred during the financial crisis. Since then, merchandise exports have been growing at over 9% p.a.

Graph courtesy of Wikipedia, click to enlarge
While trade and shipping volumes have recovered, shipping rates have not. The standard measure for shipping rates that exclude oil and containers, the Baltic Dry Index*, recently shows the most alarming volatility:
Graph courtesy of Wikipedia, click to enlarge
*The Baltic Dry Index provides an assessment of the price of moving the major raw materials by sea. Taking in 23 shipping routes measured on a time-charter basis, the index covers dry bulk carriers carrying a range of commodities including coal, iron ore and grain.
The Harper-Peterson Index for transporting containers and the Baltic Dirty Tanker Index for transporting oil also boomed in the years preceding the financial crisis. Prices have yet to recover. Ship owners ordered too many ships in the boom years preceding 2009 and, as two years pass between order and delivery, ships were still coming onto the market when international trade had crashed. Fleets are young and it will take years for shipping rates to recover.
However, shipping volumes continue to increase and shipbrokers that provide services for shipping have benefited. Braemar Shipping Services (BMS) is one. Braemar's share price (in blue) is more volatile than the FTSE Small Cap Index (in green) to which it pertains:
Graph courtesy Yahoo, click to enlarge
But Braemar's earnings and dividends are more stable than one would expect from the above chart or from the volatility in shipping prices:

Braemar
2004
2005
2006
2007
2008
2009
2010
2011
2012
2013
Earnings
Per share pence
14
29
36
32
49
56
47
47
33
32
Dividend
Per share pence
13
16
18
19
23
24
25
26
26
26

 The relative stability in Braemar's results is thanks to management's role in reducing its dependency on ship broking. In 2007, 84% of the company's operating profits came from ship broking and only 16% from its other activities - technical support, logistics and environmental services. In 2013, ship broking accounted for only 40% while technical (25%), logistics (15%) and environmental services (20%) contributed 60% to operating profits. Ship broking profits fell by 39% from 2007 while the contribution from shipping services increased by almost 5 times. Braemar operates in all parts of the world.
Braemar is in good financial health. Consider:
1. The company has held net cash for every one of the last 10 years. At February 2013, net cash, at 23 million pounds, was almost a quarter of Braemar's market capitalization of 95 million pounds.
2. The balance sheet is clean of pension scheme liabilities. Braemar only offers a defined contribution pension scheme to its employees.
3.  Operating cash flow (after deducting capital expenditure) of 40 million pounds these last 5 years covered the dividend 1.6 times. Braemar has built up its newer businesses through acquisition.
4. Return on equity for the last 3 years has averaged 12%.
In Braemar's 2013 Annual Report, management expect continued decline from ship broking, an improvement in the technical and logistics business and a decline in environmental during 2103/14. There are no broker forecasts for this small company.
Braemar's nearest London-quoted competitor in ship broking and services is Clarkson PLC, a constituent of the FTSE 250 Midcap. As such, Clarkson attracts the interest of analysts. Braemar and Clarkson have a similar recent trading history, but Clarkson's shares (at 1900p) are rated much more highly than Braemar's (at 458p):
 
P/E Ratio
Dividend yield
Price:Book ratio
Net cash as % market value
Braemar
   14
      5.8%
       1.35
             24%
Clarkson
   22
      2.7%
       2.84
             32%


Compared to Clarkson, Braemar looks to be good value at its current price of 455p. But the investor will want to consider the following:
1. Braemar's main business continues to be ship broking, which is still in recession.
2. While shipping volumes are increasing, there is still an excess of ships of all kinds and there is no sign that rates are recovering.
3. When it comes, the increase in shipping rates, as measured by the Baltic Dry Index, is likely to be sudden. And this will be reflected in Braemar's share price.
4. As the stock market anticipates cyclical recoveries, the investor is seemingly left with the option of buying in early, in the hope of anticipating the market anticipating the recovery. The risk is that the cycle has not reached bottom.